Filters

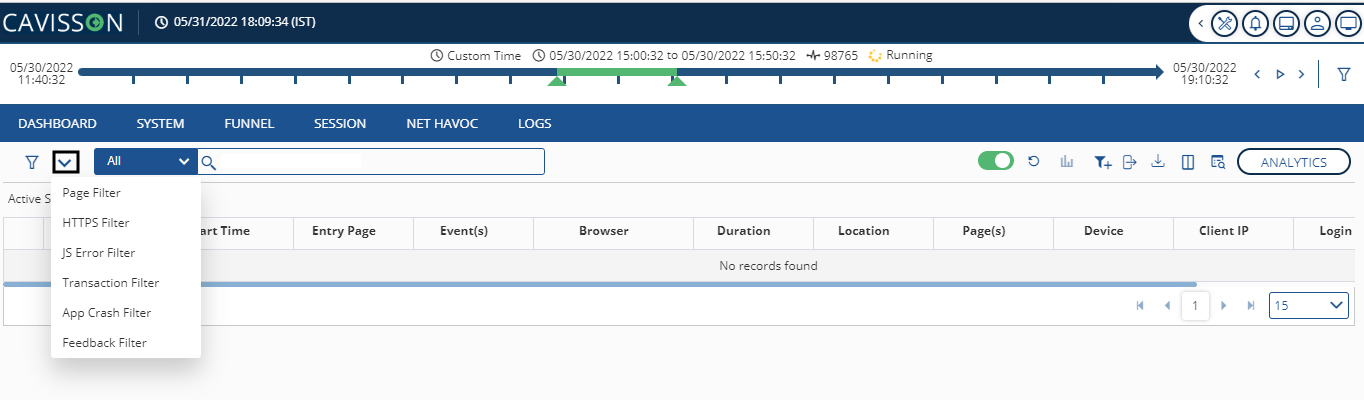
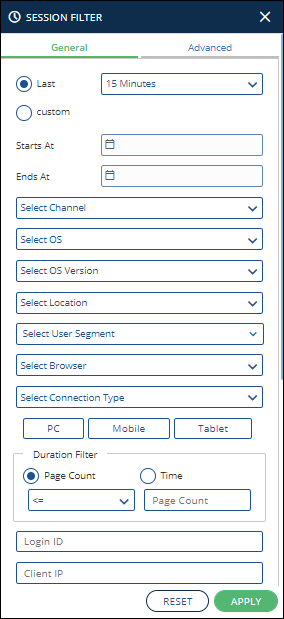
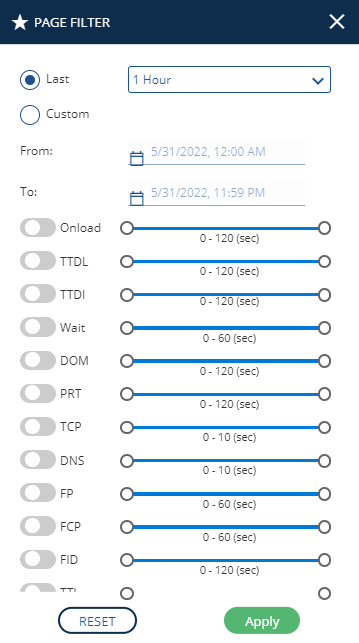
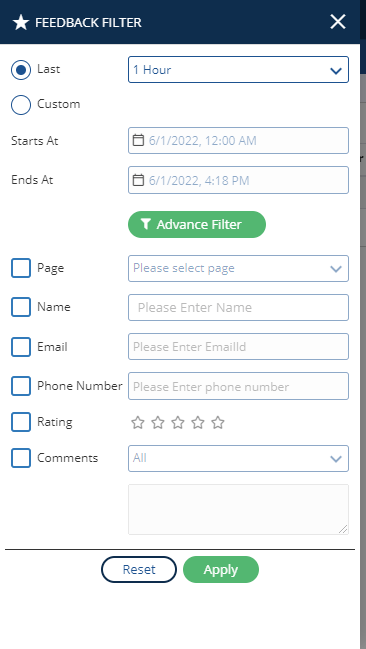
Users can apply various filters to get the filtered results. By default, Session Filter is selected. You can see the various filters by clicking the  icon on the top left corner of the session Window page as shown in below figure.
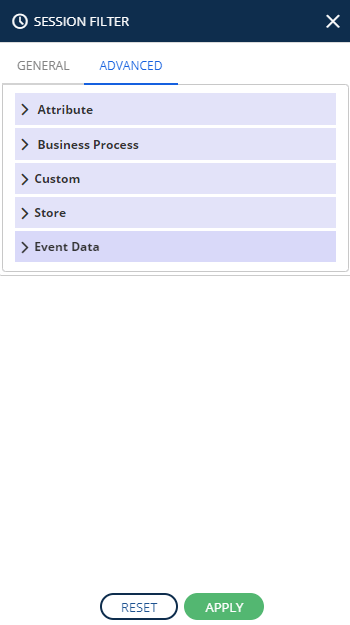
Figure 54: Filter drop-down

Session Filter

Click the Filter icon  on the left top corner of the  Session Window page to open the Session Filter window:

Figure 55: Session Filter

The session filter has following two options:

  • General Filter
  • Advanced Filter

General Filters

Specify the following filters:

  • Last: Specify time filters, such as last duration (such as 15 minutes, 1 hour, 1 week, 1 day, 1 week, and so on)
  • Custom: Specify the required Start and End date range.
  • Select Channel: A channel is the medium through which a user can access the site. Select the Desktop option here.
  • Select OS: Specify the operating system used for accessing the site.
  • Select OS Version: Specify the version of the operating system used for accessing the site.
  • Select Location: It is the location from where the session is accessed.
  • Select User Segment: It is a group of users having some common behavior or attributes.
  • Select Browser: It denotes the browser used while accessing the site.
  • Select Connection Type: Specify the type of connection used to access the site.
  • Select a Device: It denotes the device, such as PC, mobile, tablet on which the session is accessed.
  • Duration Filter: Apply the filter either on page count or time and accordingly apply the settings.
  • Advanced Filters: Click the Advanced Filters tab to apply some advanced level filters to include/exclude in the results.

Advanced Filters

You can apply the following Advanced filters:

  • Attribute
  • Business Process
  • Custom
  • Store
  • Event Data
Figure 56: Advanced Filters

Attributes

Attribute filters are those filters that are based on the session attributes, such as entry/exit page, page/referrer URL, device and user specifications and so on. It is applicable in the case of completed sessions only.

Figure 57: Attribute

Click the  icon to see the fields in attributes.

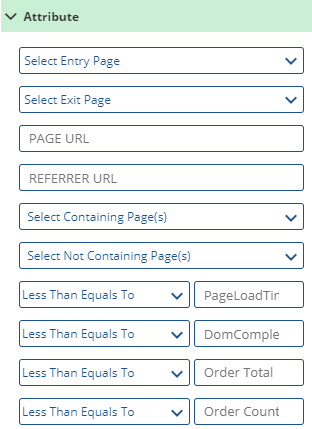
You will get the following fields in the attributes:

  • Select Entry Page: This denotes the entry page of the session. From the drop-down select the relevant entry page.
  • Select Exit Page: This denotes the exit page of the session. From the drop-down select the required entry.
  • Page URL: This denotes the URL of the page on which the filter is to be applied.
  • Referrer URL: When visiting a webpage, the referrer or referring page is the URL of the previous webpage from which a link was followed.
  • Select Containing Page: It denotes a list of pages. Users can select such pages that are contained in the session on which filter needs to be applied.
  • Select Non-Containing Page: It denotes a list of pages. Users can select such pages that are not contained in the session on which filter needs to be applied.
  • Page Load Time: This denotes the time taken to load a page. 
  • DOM Complete Time: This denotes the time taken for DOM completion. 
  • Order Total: The user can set a condition (such as <, =, >) to filter the order total from here.
  • Order Count: The user can set a condition (such as <, =, >) to filter the order count from here.


Business Process Filter

Business process filters are those filters, which are based on pages (defined in the business flow), visited and the events that occurred on such pages. It is applicable in the case of completed sessions only.
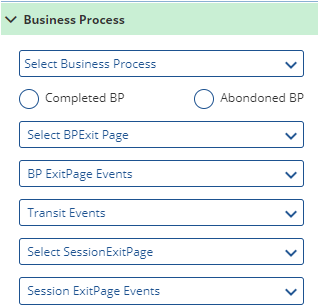
Figure 58: Business Process Filter

Click the  icon to see the fields in Business Process. You will get the following fields:

  • Business Process Name: Select BP name from the dropdown list. It is enabled by either selecting the Completed BP or Abandoned BP check box.
  • Completed BP: This filters out those sessions in which the user has visited all the pages defined in the business flow. It generates a list of completed business processes. Other options are not enabled on selecting this.
  • Abandoned BP: This filters out those sessions in which the user has exited from the business flow. It generates a list of abandoned business processes. Selecting this, other options are enabled
  • BP Exit Page: From the drop down select the relevant option as per requirement.
  • BP Exit Events: Select the check box and the relevant option as per requirement.
  • Transit Events: Select the check box for Transit page events or no events. 
  • Session Exit Page: Select the check box and Session Exit page.
  • Exit Page Events: Select the checkbox and relevant option from the drop-down.

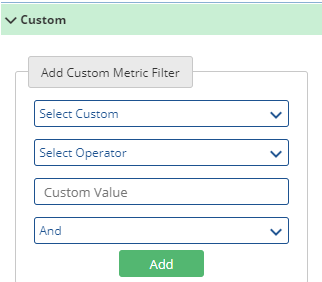
Custom Metric Filter

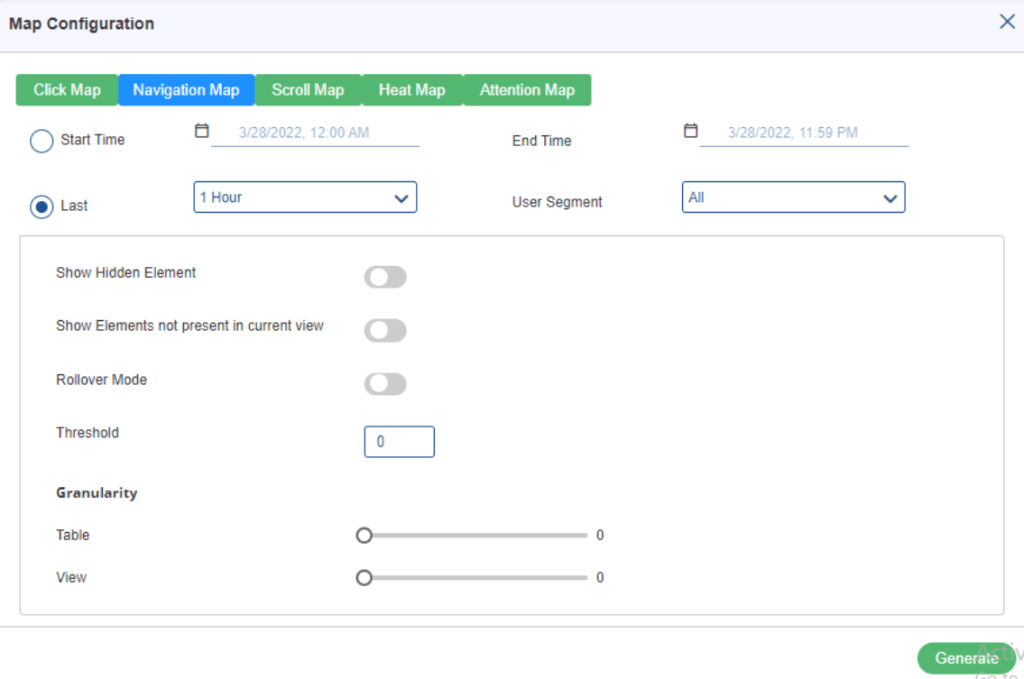
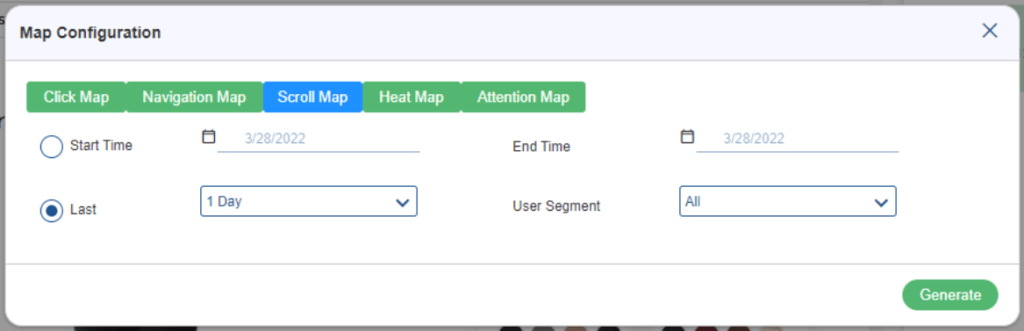
Select the custom data parameter. This is to filter out session based on some custom/special criteria that can be modified according to the requirements. We have the following fields as shown in below figure.

Figure 59: Custom Filter

Fill the following fields to add Custom metric:

Custom: Select the relevant option from the drop-down.

Operator: Select the operator from the drop-down.

Custom Value: Value of the custom data to filter.

Operator either AND or OR. This is used to add multiple conditions while running the query. 

Store Filter

It denotes the store for which the session is done.

Figure 60: Store Filter

Associate ID:  This denotes the ID of the associate.

Transaction ID: This denoted the ID of the transaction.

Event Data

It denotes the data of an event.

Figure 61: Event Data Filter

Page Filter

Here, the user can apply various filters on the page, such as time filter, session data filter, page data filter, and store name filter.

Figure 62: Page Filter

Here, we are describing each and every filter criterion that can be applied on a page. 

Time filter

We have the following option in this filter:

  • Last Duration: It generates a list of pages based on a particular duration. User can specify the duration, such as 1 hour, 1 day, 1 week, and so on. All the pages that lie within that duration is captured.  
  • Specified Time/Custom: It generates a list of pages based on the specified date and time range. Users can specify the time duration containing the date range (in mm/dd/yy) and time range (in hh:mm:ss). All the pages that lie within that duration are captured. By default, the date ranges from the current date to the current date and the time ranges from (00:00:00) to the current date. In specified time, user can have customized the time duration for the captured session


HTTPS Filter

HTTP filters are used to filter out the session for some particular HTTP request. Here, the user can apply various HTTP filters, such as time filter, HTTP request attribute filter, session attribute filters, mobile app filter, and store name filter.

Figure 63: HTTPS Filter

Time Filter

There is the following option in this filter:

  • Last Duration: It generates a list of pages based on a particular duration. User can specify the duration, such as 1 hour, 1 day, 1 week, and so on. All the pages that lie within that duration is captured.  
  • Specified Time/Custom: It generates a list of pages based on the specified date and time range. Users can specify the time duration containing the date range (in mm/dd/yy) and time range (in hh:mm: ss). All the pages that lie within that duration is captured. By default, the date ranges from the current date to the current date and the time ranges from (00:00:00) to (23:59:59).

JS Error Filter

This is the console error captured by NetVision. This displays information, such as action, time, error message, JF file name, error line, and error column.  This filter shows the error caused by javascript syntax

Figure 64: JS Error Filter

General Filter

There is the following option in this filter:

  • Last: Specify time filters, such as last duration (such as 15 minutes, 1 hour, 1 week, 1 day, 1 week, and so on)
  • Custom: Specify the required Start and End date range.
  • Select Channel: A channel is a medium through which a user can access the site. Select the Desktop option here.
  • Select User Segment: It is a group of users having some common behavior or attributes.
  • Select OS: Specify the operating system used for accessing the site.
  • Select Browser: It denotes the browser used while accessing the site.
  • Auto: In this duration of the session is applied.
  • Group by: In this, the categories like page, OS, OS version is selected.

Advanced Filters

  • Select Location: It is the location from where the session is accessed.
  • Select Page: In this the category/stage is selected.
  • Select OS: Specify the operating system used for accessing the site.
  • Select Browser: It denotes the browser used while accessing the site.


Transaction Filter

Here, user can apply various transaction level filters on session, such as time filter, transaction attribute filter, session attribute filter, store filter. User needs to specify the filter criteria and execute it using the Run button. Here, we are describing each filter criterion that can be applied on a session.

Figure 65: Transaction Filter

Time Filter

There is the following option in this filter:

  • Last Duration: It generates a list of pages based on a particular duration. Users can specify the duration, such as 1 hour, 1 day, 1 week, and so on. All the pages that lie within that duration are captured.  
  • Specified Time/Custom: It generates a list of pages based on the specified date and time range. Users can specify the time duration containing the date range (in mm/dd/yy) and time range (in hh:mm: ss). All the pages that lie within that duration is captured. By default, the date ranges from the current date to the current date and the time ranges from (00:00:00) to (23:59:59).

App Crash Filter

App crash filter is mainly used for mon=bile app to check in which session the app got crashed.

Figure 66: App Crash Filter

General Filter

There is the following option in this filter:

  • Last: Specify time filters, such as last duration (such as 15 minutes, 1 hour, 1 week, 1 day, 1 week, and so on)
  • Custom: Specify the required Start and End date range.
  • Select Channel: A channel is the medium through which a user can access the site. Select the Desktop option here.
  • Select User Segment: It is a group of users having some common behavior or attributes.
  • Select Page: In this the stage/process is selected.

Advanced Filters

  • Device: This denotes the device used (such as PC, mobile, tablet) while executing the session.
  • Platform: This denotes the platform (such as iOS, Windows, Linux) from where the session is executed.
  • Location: This denotes the platform (such as iOS, Windows, Linux) from where the session is executed.
  • Mobile carrier: It denotes the mobile operator which is used by the user.
  • Connection Type: This filter is based on the connection type, such as Dialup, ISDN, Cable, DSL, FTTX, and Wireless with the mobile application.

Feedback Filter

Feedback filter is used to see the feedback given by the user.

Figure 67: Feedback Filter

General Filter

  • Last: Specify time filters, such as last duration (such as 15 minutes, 1 hour, 1 week, 1 day, 1 week, and so on)
  • Custom: Specify the required Start and End date range.

Advanced Filter

  • Page: It is the page on which the feedback is given.
  • Name: It shows the name of the user.
  • Email: It is the email id of the user.
  • Phone number: Here user phone number is to be entered.
  • Rating: It shows the rating given by the user.
  • Comments: It shows the feedback written by the user.

Search

Using the Search field in the Session window, you can search any record across all the sessions. To facilitate your search, auto suggestions are provided when you search for a particular text. For example, while searching all the sessions accessed via the Chrome browser, you enter Chrome in the search box. The system suggested various fields are listed where you can search this text. You can add multiple search parameters in the same way (for example – Home).

Figure 68: Search Field

You can search the following parameters:

  • Browser
  • Operating System
  • Order-ID
  • Visitor-ID
  • Login-ID
  • Application Pages
  • Test
  • Page URL
  • Method
  • Response time
  • Status Code


Apart from smart search, users can perform the following actions from this window:

  • Replay a Session
  • Open a Session
  • Filter Sessions
  • Apply-d Sessions
  • Columns Selection
  • View Event Details


To search records:

  1. Define the search parameters in the Search text field.
Figure 69: Search option

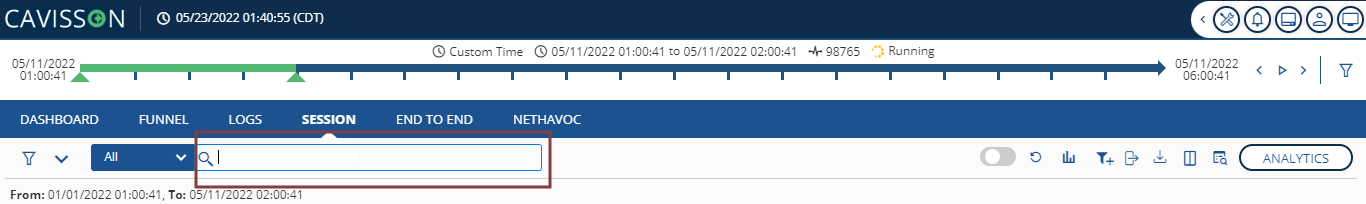
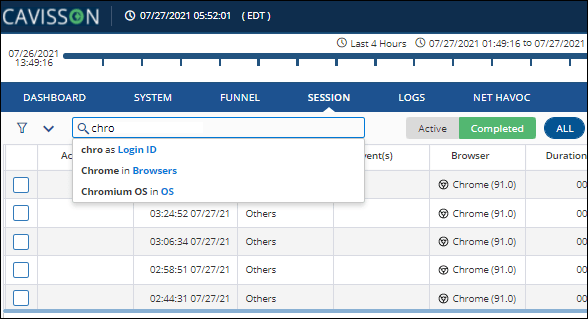
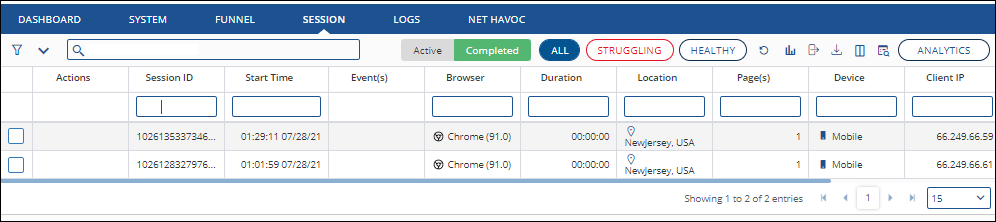
2. Click the Search icon to execute the search within the sessions. The searched results are displayed.

Similar Session Search

User can search sessions applying various filters but many times users want similar session and he/she wants to see a similar session & for that purpose a feature like similar session search is required. Similar session means session having:

  • Similar Events
  • Similar User Actions
  • Similar Page Sequence or sub sequence

There is a default filter bag available in session component. By default, that will be collapsed and on user can expand that which will slide down all the filter. Filter bag is accessible throughout NetVision and different filter for searching similar sessions can be applied from different places in the application which are as follows:

  • Pages from page list
  • Events from events list tab
  • User Action from User action tab
  • User Action from Page dumb tab

Once filters are applied there will be button in filter bag to proceed for the similar session. search for the applied filters which are then process for the request and respond with similar session found.

Reload Sessions

To reload a session, click the Reload Session  icon.

Figure 70: Reload session Icon

View Session Trend

A session trend provides information about the total number of sessions performed by a user in a particular time frame. It is represented as a bar chart in the graphical form.

To view a session trend, click the Session Trend icon in the top panel of the Session Window.

Figure 71: Session Trend

Export Sessions

Export Session Details

To export session details in an excel file:

  1. Select a session from the list of sessions.
  2. Click the Export Session Details icon to download details of the session in an excel file.
Figure 72: Export Session

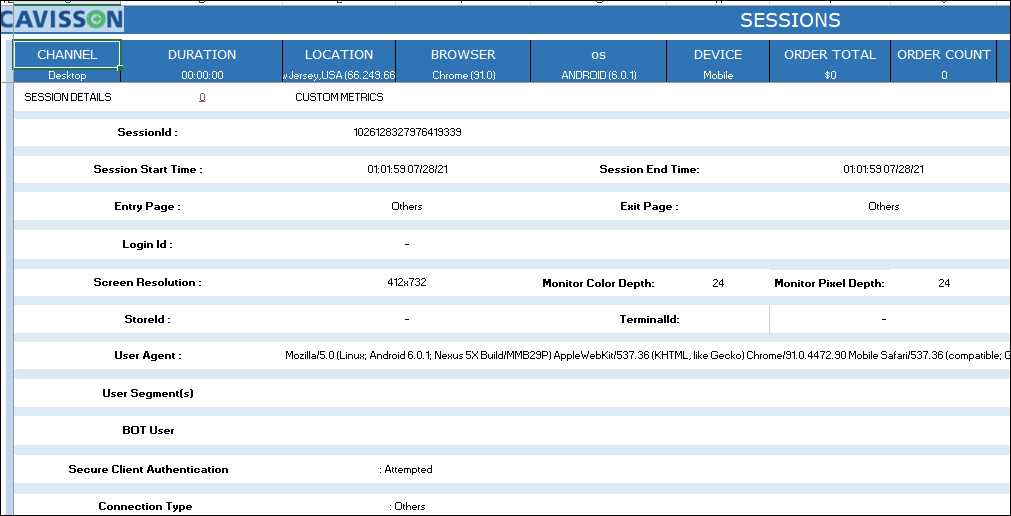
Export Sessions as PDF

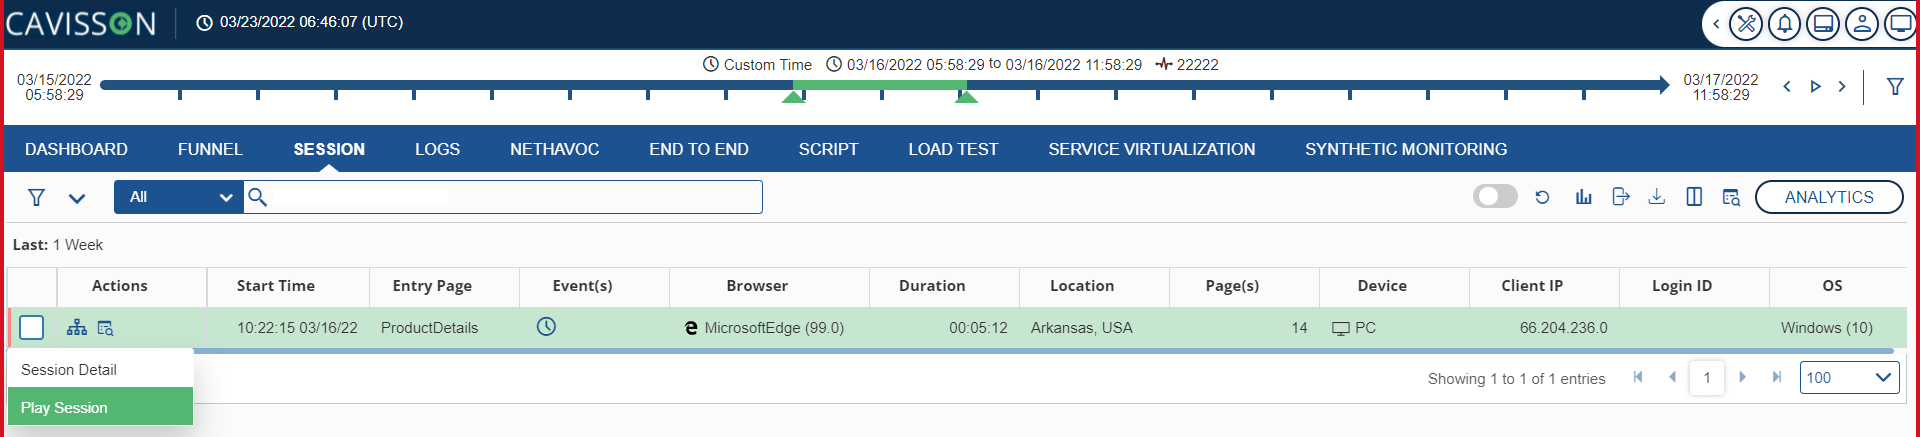
To download the session details in PDF format:

  1. Select a session from the list of sessions.
  2. Click the Export Session Details icon. 
  3. Select the Export Session as a PDF option to download details of the session in a PDF file.

Export Sessions as HTML

To download the session details in an HTML format:

  1. Select a session from the list of sessions.
  2. Click the Export Session Details icon. 
  3. Select the Export Session as HTML option to download details of the session in an HTML format.

Export Sessions as Excel

To download the session details in an Excel format:

  1. Select a session from the list of sessions.
  2. Click the Export Session Detailsicon.
  3. Select the Export Session as an Excel option to download details of the session in an Excel format.
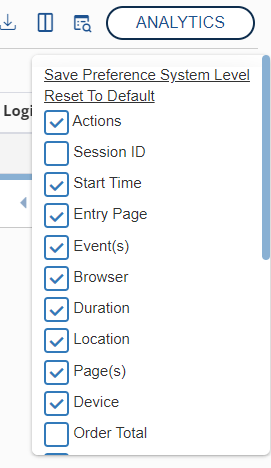
Toggle Columns

You can organize the columns in the Session window according to your requirements. To reorganize column arrangement:

  1. Click the Toggle Column icon. 
  2. Select the column that you want to be present in the Session window:
Figure 73: Toggle Column

Apply Column Filter

To filter the metric names in each column:

  1. Click the Column Filter icon . A text box is added below each column heading:
Figure 74:Column Filter

2. Specify the required metric name in the column text box.

Session Replay

To replay a recorded user session:

  1. Right-click in the Actions column and select Play Session, as shown in the Figure 75:
Figure 75: Session Replay

The Replay screen is displayed where you can view the recorded user session.

Figure 76: Replay Session page

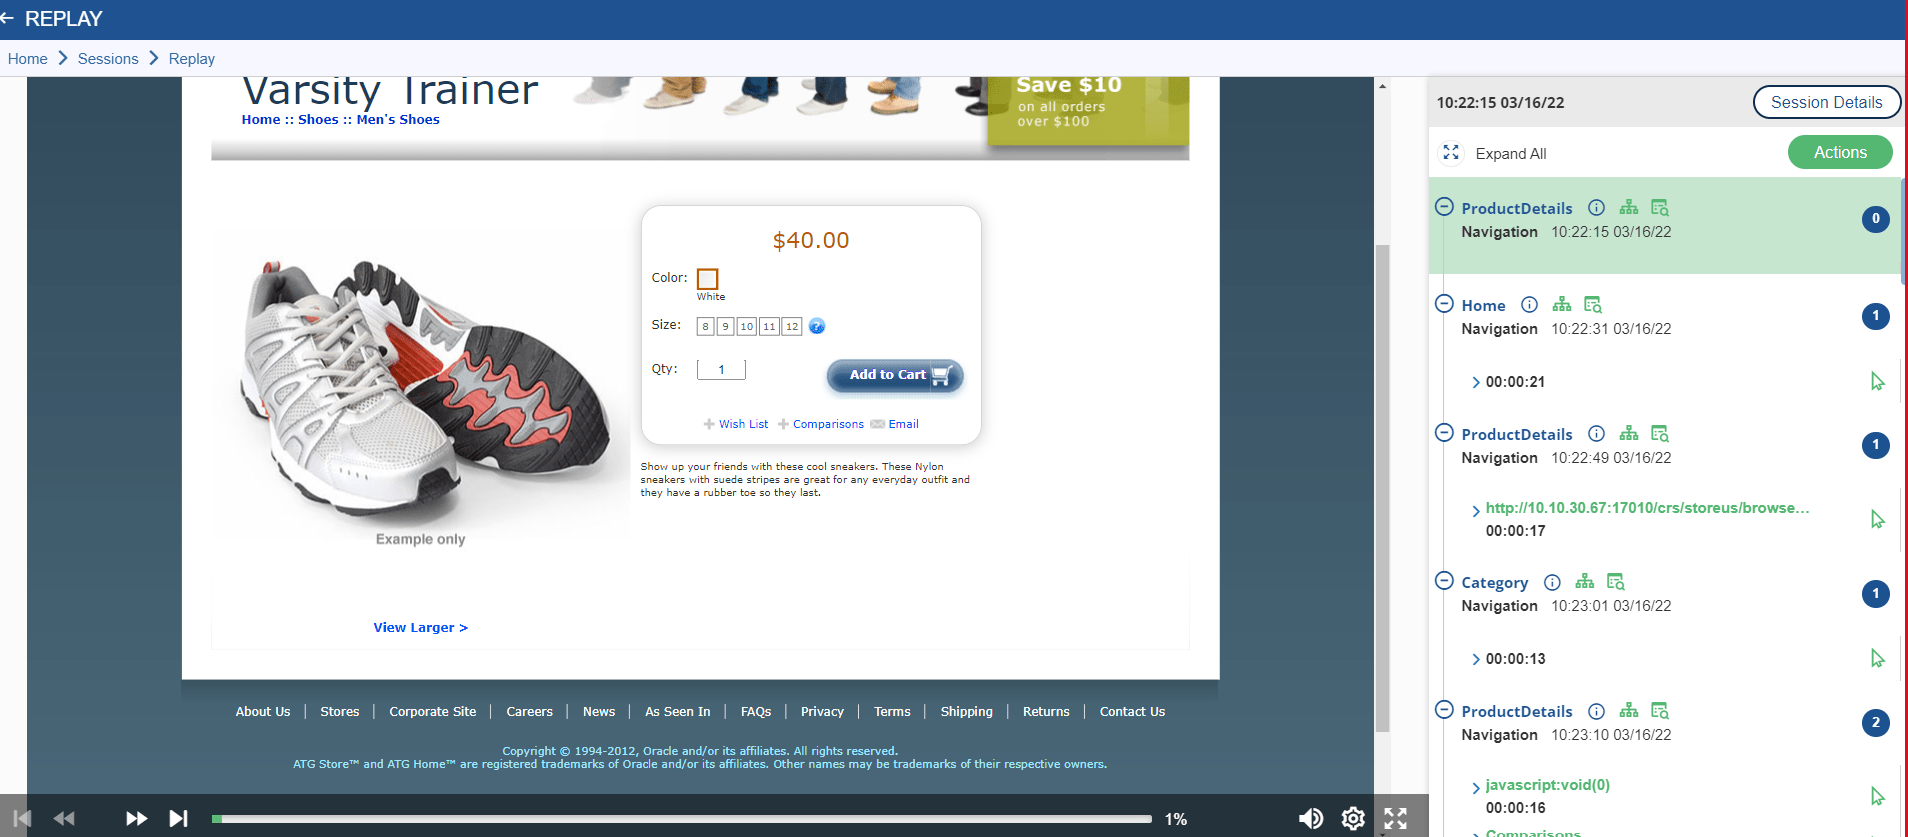
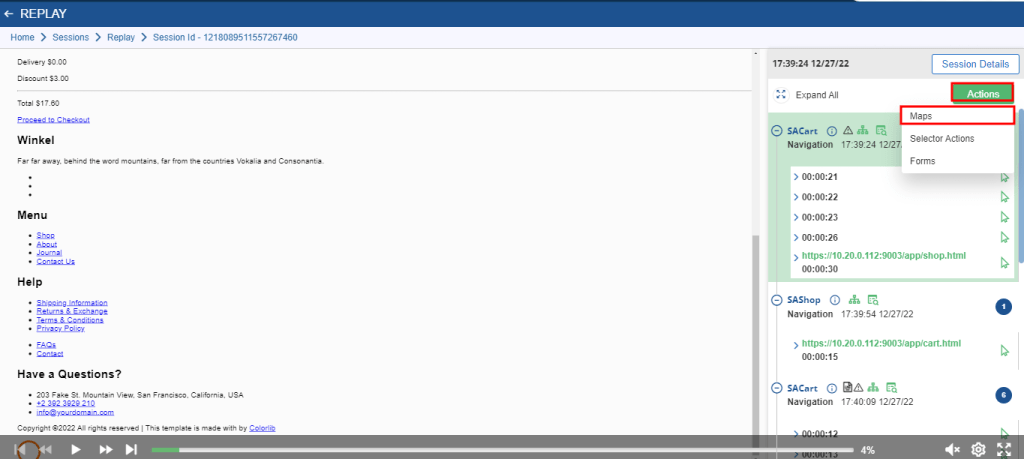
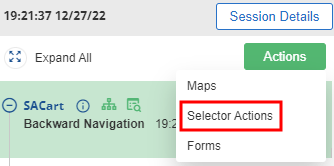
You can view the session on the left pane of the window. The right pane consists of several navigators and other action items, such as play controls, a progress bar, and others.

Voice Commentary Support

You can enable the voice commentary option in the Replay videos to listen to the series of actions performed by a user. Enabling voice commentary provides the following benefits:

  • Makes replay a self-explanatory program
  • Narrates the actions that are taking place at the same time.
  • Efficiently provides information to the replay visitor in a way that is easy to understand
  • Increases the customer experience of analyzing the replay videos.

Enabling Voice Commentary

Click the audio icon  in the Replay control bar to enable and disable the voice commentary in replay videos.

Customizing the Video Language

To change the language used in the voice commentary of a replay video:
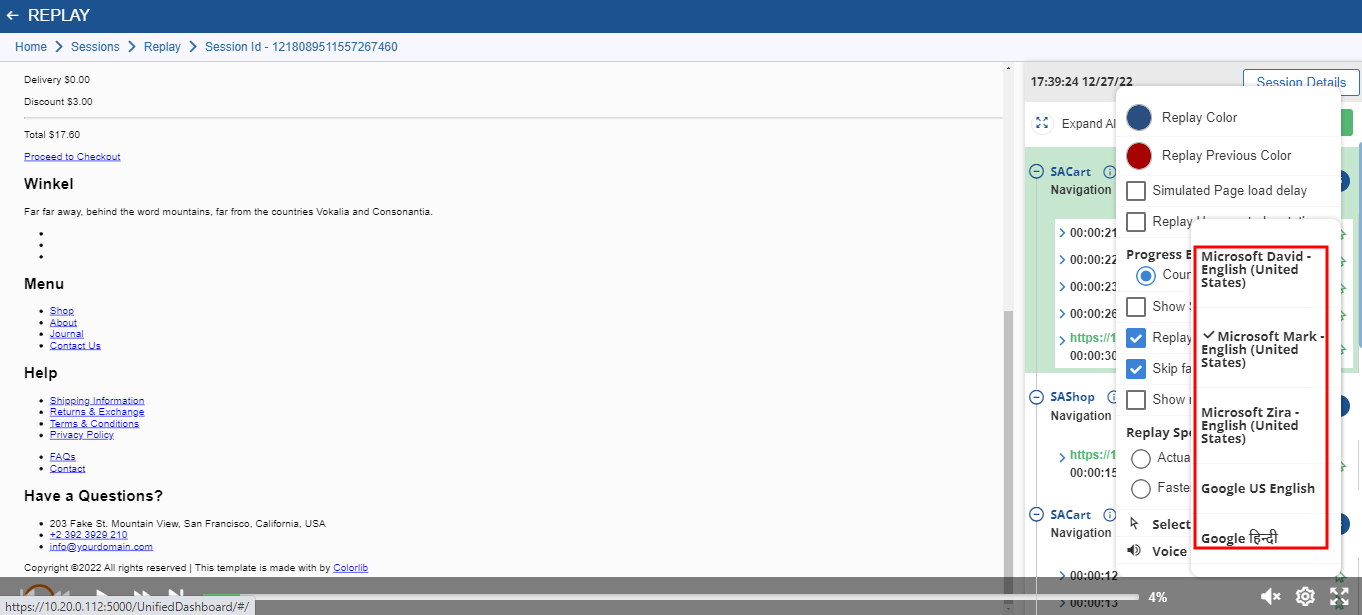
  1. Click the Settings icon in the Replay control bar.
Figure 77: Settings Navigation
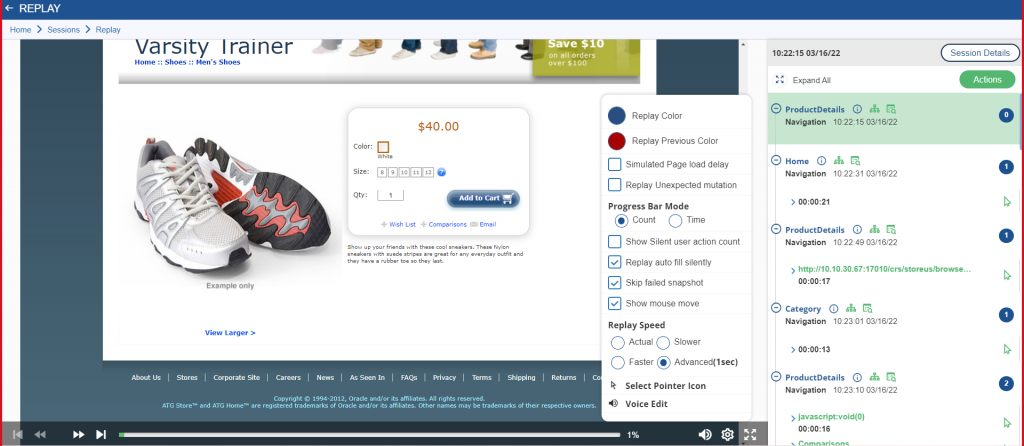
  • Replay Color: It is to replay the current color.
  • Replay Previous Color: To replay the previous color, select this option.
  • Stimulated Page load delay: To simulate the page load, select this option.
  • Replay Unexpected Mutation: Enable this option to replay unexpected mutations.
  • Progress Bar Mode
    Count: Select this option to see the progress bar mode in terms of count.
    2. Time: To view the progress bar mode in terms of time.
  • Show silent user action count: To see silent user action count, select this option.
  • Replay auto-fill silently: To Replay auto-fill silently, select this option.
  • Skip failed snapshot: To skip failed snapshots, select this option.
  • Show mouse move: For showing a moving mouse, select this option.

  • Replay Speed
  • Actual
  • Slower
  • Faster
  • Advanced(1 sec)
  • Select Pointer Icon
  • Voice Edit
  1. Click the Voice Edit icon. 
Figure 78: Voice Edit icon

2. Select the required language from the drop-down list as shown below:

Figure 79: Language Change Option

Actions

Through actions, the user can have the following options:

  • Maps
  • Selector Actions
  • Forms

Map Configuration

To open the Map Configuration window:

  1. Select Actions > Maps in the Replay window.
Figure 80: Mapping

2. The Map Configuration window is displayed:

Figure 81: Map Configuration

The following reports are available in the Map Configuration window:

Click Maps

As shown in Figure 82 , Click Maps represents elements and the click count on that element visually. This helps the developer/Business users to understand the click behaviors of users.

Figure 82: Click Map

This report displays the user view percentage on clicked elements.  Data is also presented in the Element tree on the right pane in order of click counts. It has the following fields:

  • Start Time: Select the start time of Map configuration in click map.
  • End Time: Select the end time of the click map configuration.
  • Last: The time period for which configuration is to be done.
  • User Segment: Select the user segment from the drop down or select all options.
  • Show Hidden Element: Enable this option to see the hidden element.
  • Show Elements not present in current view: Enable to view elements not present in current view.
  • Rollover Mode: Enable to see the map in rollover mode.
  • Threshold: Enter the threshold limit in this field.
  • Granularity: It is the amount of detail required to view the data. In this, there are two option:
  • Table
  • View


Navigation Map

This report helps a business user to visually understand the navigation from a given page and enables them to understand how a user is leaving a page.  With the help of this report, users can remove unwanted navigation/links

Figure 83: Navigation Map

This report displays the user view percentage on clicked elements. Data is also presented in the Element tree on the right pane in order of click counts.

Scroll Map

The Scroll Map helps in understanding the reachability of a web page. Using this map, you can find the percentage of user views on a certain position of a web page.

Figure 84: Scroll Map

Scroll Map consists of following fields:

  • Start Time: Select the start time of Map configuration in click map.
  • End Time: Select the end time of the click map configuration.
  • Last: The time period for which configuration is to be done.
  • User Segment: Select the user segment from the drop down or select all options.


Heat Map

Figure 85: Heat Map

Heat Map has following fields:

  • Start Time: Select the start time of Map configuration in click map.
  • End Time: Select the end time of the click map configuration.
  • Last: The time period for which configuration is to be done.
  • User Segment: Select the user segment from the drop down or select all options.

Attention Map

Attention map shows which feature or icon is eye catching or the user is interested to navigate. It shows what parts of the page are most and least actively engaged by using a colored overlay. By watching the color change, you can interpret the level of activity on the page. The hotter the activity, the hotter the color. The cooler the color gets, the lesser the activity.

Figure 86: Attention Map

Selector Actions

To open the Selector Action window:

Select Actions > Selector Actions in the Replay window.

Figure 87: Action Drop down

The Selector Action window is displayed:

Figure 88: Selector Action

The following reports are available in the Selector Action window:

  • Tag Name: Select if there is any pre-defined Tag or enter a Tag name
  • Attribute: Enter the attribute name and its value.

Forms

To open the Form window:

  1. Select Actions > Form in the Replay window.
Figure 89: Action Drop down

2. The Form window is displayed as shown in below figure:

Figure 90: Form Window

The following reports are available in the Form window:

  • Last: It is selected to view the most recent date. The session shows can be of last 15 minutes, 1 hour, 4 hours, 12 hours, and 1 day. By default, the last is selected as 1 day.
  • Custom: It shows the session for the time period you wanted to see. Here you will see the option of Start Time to End Time.